
Evaluation Metric Special ROC-AUC
A receiver operating characteristic curve, or ROC curve, is a graphical plot that illustrates the diagnostic ability of a binary classifier system as its discrimination threshold is varied. Remember True Positive Rate and False Positive Rate ? The ROC curve is created by plotting the true positive rate (TPR) against the false positive rate (FPR) at various threshold settings.
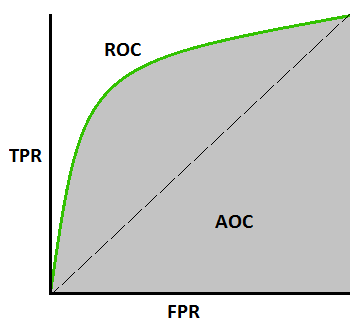
ROC is a probability curve and AUC represents degree or measure of separability. It tells how much model is capable of distinguishing between classes. Higher the AUC, better the model is at predicting 0s as 0s and 1s as 1s. By analogy, Higher the AUC, better the model is at distinguishing between patients with disease and no disease.
An excellent model has AUC near to the 1 which means it has good measure of separability. A poor model has AUC near to the 0 which means it has worst measure of separability. In fact it means it is reciprocating the result. It is predicting 0s as 1s and 1s as 0s. And when AUC is 0.5, it means model has no class separation capacity whatsoever.
How to use AUC ROC curve for multi-class model?
In multi-class model, we can plot N number of AUC ROC Curves for N number classes using One vs ALL methodology. So for Example, If you have three classes named X, Y and Z, you will have one ROC for X classified against Y and Z, another ROC for Y classified against X and Z, and a third one of Z classified against Y and X.

Leave a comment